TradeStation Made Easy!
 Don't let the size of this book fool you. It's 746 pages of "How To" and numerous examples, walking you through from opening the box to programming profitable systems with EasyLanguage. It's about time someone made this powerful and extensive software easy to understand!
Sunny has been teaching her "Solving the Puzzle" seminars for 20 years. Now it is all contained in one book--a book that actually makes TradeStation and EasyLanguage easy to use. Something that none of TradeStation's documentation does.
- To purchase the TSME Online Training Course, click here, only $3,000 for the course and personalized instruction as needed.
- To purchase this new book, click here to go to Amazon.com. Or, Click here to order from Traders' Library.
To purchase an autographed copy of the book, click here. 

- To read pages 1-19, including Chapter 1, for free click here.
- TradeStation Made Easy! wins First Place in the prestigious STAR Awards by TraderPlanet.com for 2010. View their Press Release.
- Readers have been asking me for color copies of the figures in TSME. I'm going to be putting them up at TSMEFigures. Just click on that link to see how far I've gotten. Keep coming back as I will continue to add more figures as time permits.
- Click here to read what others are saying about TSME.
- View the ERRATA Sheet for mistakes I and others have found, below.
Readers of this newest Sunny Harris book, come here for downloads mentioned in the book.
- Data for DIS download is here.
- Color chart RGB values click here.
- ELAs for indicators and strategies mentioned in the book click here
- Text for indicators and strategies mentioned in the book click here
- Sample Log Book click here. It is an Excel workbook in 2003 format.
Errata Sheet (Corrections to the Manuscript)
Description and Information
Most all traders use trading software. With hundreds of thousands of users, perhaps the most popular trading software today is TradeStation, software designed to meet the needs of traders who program and backtest their own trading strategies. TradeStation software not only allows traders to design their own trading strategies, but one can back test them on years of historical data and then computer-automate those strategies as well. The programming language allowing this powerful ability is EasyLanguage®.
Mastering this programming language allows a trader to test any idea he or she desires, but often the path to this is difficult, especially for the novice. This is where Sunny Harris and her comprehensive book, TradeStation Made Easy! can make life whole lot easier for those who choose this path. One would be hard pressed to find a more competent instructor in this area, or at least that is what Bill Cruz, Co-Founder and former Co-CEO of TradeStation Securities, Inc. implied when he stated,
One of the early users of TradeStation software, Sunny Harris has been studying and programming trading strategies for more than 30 years.
Overview
Sunny Harris is eminently qualified to write this book. Not only does she possess degrees in theoretical math, she also has artistic and graphic talents that bring logic and intuition to her understanding of markets and software development. This qualitative characteristic comes through strongly in the book, as does Harris’ 20 years of experience teaching others to trade, and her long history of working with software. Want more? She has written four other books focused on helping beginning traders (Trading 101—How to Trade Like a Pro, Trading 102—Getting Down to Business, Electronic DayTrading 101, and Getting Started in Trading). All of this experience, knowledge, and understanding gives her impeccable teaching credentials for this book. Equally important, though, she translates her highly technical experiences into a useful and practical approach to learning and utilizing EasyLanguage®.
Another quality of Harris is her ability to write well. This makes moving through this rather technical book less laborious than one might think. Her relaxed tone and smooth style lead the reader easily through the myriad steps of creating trading strategies with EasyLanguage®. More importantly, her words clearly suggest she is up to the task of helping you.
In this book, I share with the reader not only what I learned through three solid and dedicated years of 18-hour days of labored research, but what I have learned subsequently through real-time trading.
TradeStation Made Easy! is not just manual, per se. It is so much more than that. Like any good cookbook, hours and hours of experimentation and testing went into perfecting the recipes and more hours went into writing a good book. Harris’ book is no different. As Harris says,
There is no need for you to repeat my errors, nor for you to hunt and peck your way to success. In this book, I hope to lead you through the process of installing the program, using it for the first time or two, and writing your first several indicators and strategies.
The book is an invaluable guide for trading strategy development and its contents will contribute greatly to the understanding and improvement of your EasyLanguage® skills. Harris utilizes graphs, charts, and real-life examples to help illuminate and illustrate the somewhat complex process, or at least complex is how it appears. Don’t be fooled. Developing trading strategies with EasyLanguage® only seems as if it should be complex. In reality, TradeStation software is so intuitive and so well designed that what otherwise would be a complex process turns into a “paint by the numbers” process. Again, in the words of Harris,
TradeStation almost doesn’t need a manual. It is so easy to use, and so intuitive, that it almost seems silly to write this book.
The word “almost” qualifies her statement, but just to be crystal clear, Harris writing this book is far from silly. In fact, it is a book many TradeStation users will find helpful, necessary, and completely without comparison to any other on this subject.
Conclusion
If your goal is to develop your own trading strategies that can be backtested and then computer-automated, TradeStation is the trading platform for you. If you want to maximize your ability to do this, become as efficient as you can be when doing it, and end up with a finished product that will take you ever closer to trading success, then TradeStation Made Easy! is the book for you.
Ben Franklin said, “A penny saved is a penny earned.” What he could not have imagined back then in those days of quills and paper is the complex tools we would need in this age to become successful traders. If he could have seen the need today, he might have amended his maxim to fit today’s sophisticated trading world. He might have said instead, “Money spent on quality trading tools is money earned back many times over.” If you are a TradeStation user, this book belongs right next to you as you develop that quintessential trading strategy. If you want some expert help developing that strategy, take an enjoyable walk on the Sunny side of the process, an easy walk with Sunny Harris and her book that is.
(From the TraderPlanet website, by Darrell Jobman)
Templates Mentioned in Chapter 6:
Click here to download ELAs for Examples in TSME
Indicator Template:
{INDICATOR NAME AND PURPOSE: xxx}
INPUTS: xx;
VARIABLES: xx;
Condition1 = xx;
IF Condition1 THEN BEGIN
Value1 = xx;
xx;
END;
Plot1(Value1,”Value1”);
STRATEGY Template:
{STRATEGY NAME AND PURPOSE: xxx}
INPUTS: xx;
VARIABLES: xx;
Condition1 = xx;
Condition2 = xx;
IF Condition1 THEN BEGIN
BUY xx THIS BAR;
IF Condition2 THEN BEGIN
SELL xx THIS BAR;
END;
Function Template:
{FUNCTION NAME AND PURPOSE: xxx}
INPUTS: xx;
VARIABLES: xx;
Condition1 = xx;
Value1 = xx;
IF Condition1 THEN BEGIN
xx;
xx;
END;
xxx=Value1;
Figure 6.10: RSI Using SetColor showing colors for Overbought and Oversold
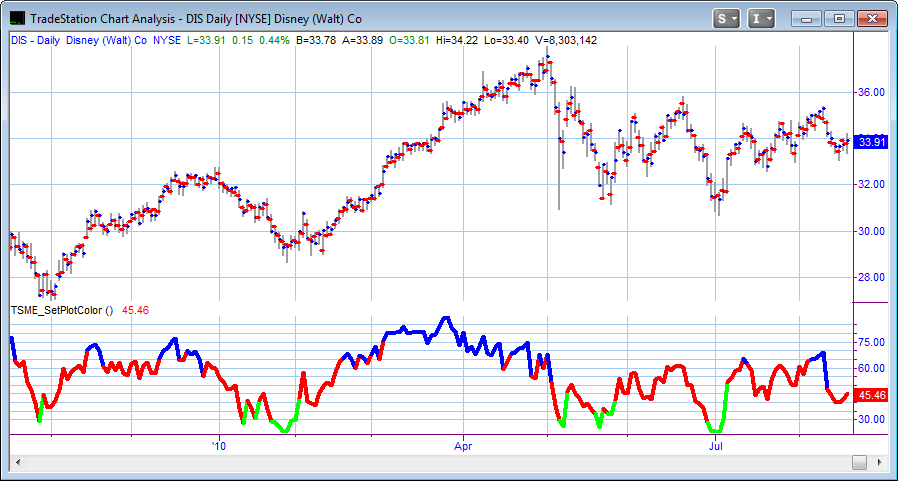
Plot1(RSI(Close, 9), "RSI") ;
If Plot1 > 65 Then
SetPlotColor(1, Blue);
If Plot1 < 35 Then
SetPlotColor(1, Green);
Code for the Indicators and Strategy Mentioned throughout the book:
Signal to Close the Open Trade
IF LastBarOnChart THEN BEGIN
IF MarketPositon = 1 THEN ExitLong;
IF MarketPosition = -1 THEN ExitShort;
END;
Indicator for 200-day Moving Average
PLOT1(Average(C,200),"200MAV");
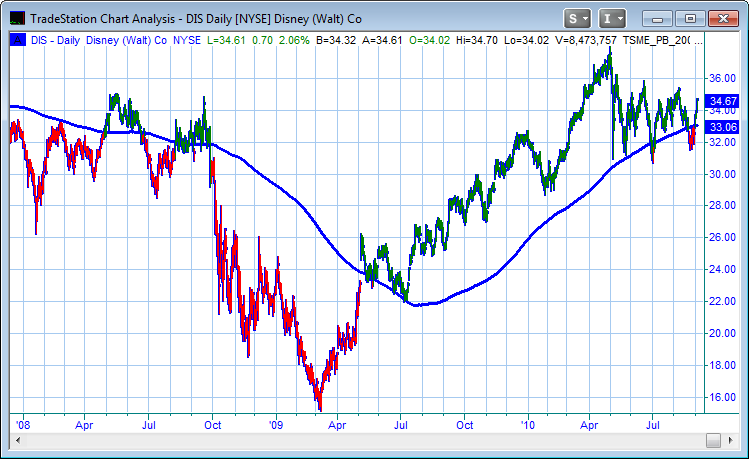
Figure E.1—Indicator: 200Day Moving Average
PaintBar for 200-day Moving Average
Value91=Average(C,200);
Condition1=H>Value91;
Condition2=L<Value91;
IF Condition1 OR Condition2 THEN BEGIN
PlotPaintBar(L,H,"PB200");
If Condition1 THEN SetPlotColor(1,DarkGreen)
ELSE IF Condition2 THEN SetPlotColor(1,Red);
END;
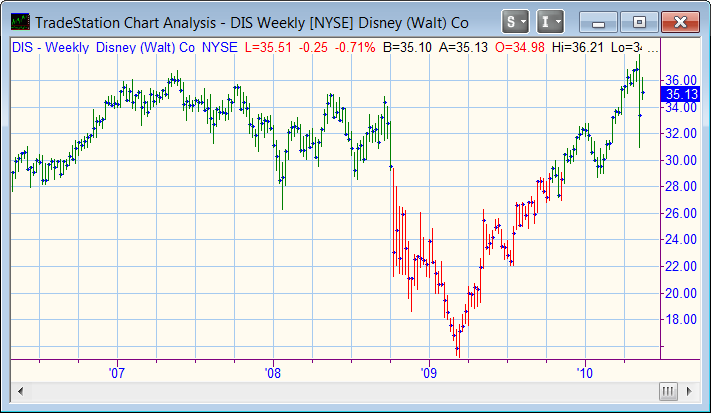
Figure D.1—PaintBar for 200-Day Moving Average
ShowMe for 200-day Moving Average
Value91=Average(C,200);
Condition1=H>Value91;
Condition2=L<Value91;
IF Condition1 OR Condition2 THEN BEGIN
Plot1(C,"PB200");
If Condition1 THEN SetPlotColor(1,DarkGreen)
ELSE IF Condition2 THEN SetPlotColor(1,Red);
END;
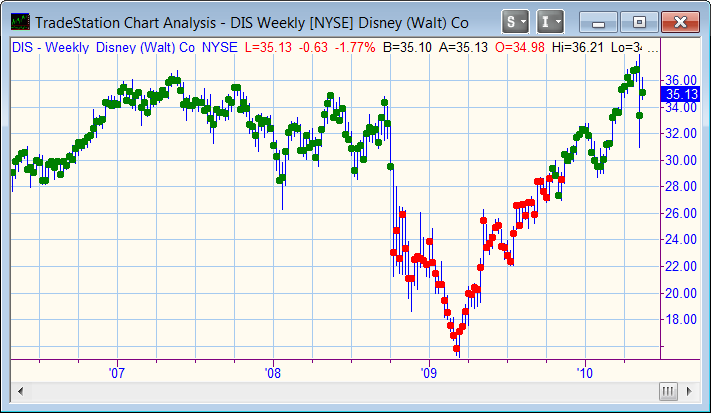
Figure D.3—ShowMe for 200 Day Moving Average
Filter for 200-day Moving Average
INPUTS: UpColor(Green), DnColor(Red), L1(200);
VARS: jtext("");
Value1 = sjh_DynamicAvg$$_f(Close,L1,.25,2,31);
IF C > Value1 THEN BEGIN
jtext = "Long";
Plot1( jtext, "MA" , white) ; SetPlotBGColor(1,UpColor);
END;
IF C < Value1 THEN BEGIN
jtext = "Short";
Plot1( jtext, "MA" ,white) ; SetPlotBGColor(1,DnColor);
END;

Figure D.4—Filter for 200 Day MAV
You may have difficulty getting this one to work at first. The trick to making RadarScreen work is to go into the Format screen and change the value in "Load additional data for accumulative calculation" to a number that is greateer than the length of the maximum calculation of the indicator. So, for the 200 day moving average, this value needs to be set to 201.
Our Strategy
INPUTS: DATE1(960101),DATE2(1101231),Length1(3),Length2(13),Leng(9),RSIleng(9),
ADXswt(0), RSIswt(0),jRSIOB(75), jRSIOS(25), xHR(180), yHR(60),Dollars(100),LossL(100),LossS(100);
IF LENGTH1<LENGTH2 THEN BEGIN
IF Date >= Date1 AND DATE<=DATE2 THEN BEGIN
Value1=xHR;
Value2=yHR;
Condition1=ADX(Leng)>ADX(Leng)[1];
Condition2=RSI(C,RSIleng)<jRSIOB;
Condition3=RSI(C,RSIleng)>jRSIOS;
IF ADXswt=1 THEN Condition1=true;
IF RSIswt=1 THEN Condition2=true;
IF RSIswt=1 THEN Condition3=true;
IF CurrentBar > 1
AND XAverage(Close,Length1) > XAverage(Close,Length2)
AND Condition1 AND Condition2
THEN BUY This Bar on Close;
IF CurrentBar > 1
AND XAverage(Close,Length1) < XAverage(Close,Length2)
AND Condition1 AND Condition3
THEN SELL SHORT This Bar on Close;
IF date>DATE2 THEN BEGIN
IF MarketPosition=+1 THEN SELL This Bar on Close;
IF MarketPosition=-1 THEN BUYTOCOVER This Bar on Close;
END;
IF BarsSinceEntry=xHR AND PositionProfit<Dollars THEN Sell This Bar;
IF BarsSinceEntry=yHR AND PositionProfit<Dollars THEN BuyToCover This Bar ;
IF PositionProfit < -LossL THEN SELL This Bar;
IF PositionProfit < -LossS THEN BUYTOCOVER This Bar;
IF Date>=LastCalcDate THEN BEGIN
SELL This Bar; BUYTOCOVER This Bar;
END;
END;
END;
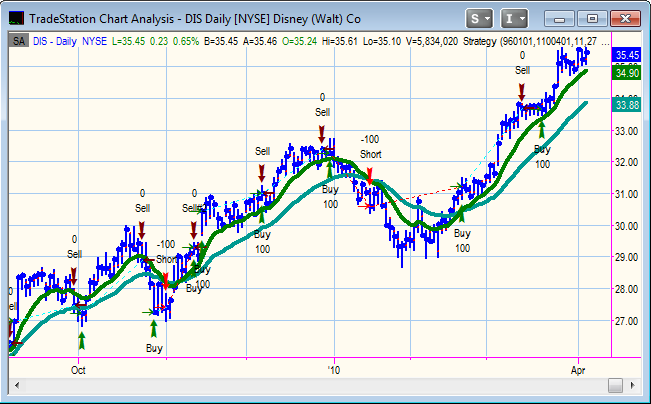
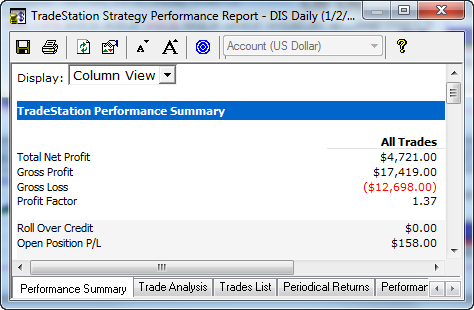
Figure D.5 & D.6—Our Strategy
If you have other questions, or if I have left anything mentioned in the book out of this page, please call me at (760) 908-3070.
Download ELAs from here:
Right-click the link, and Save Target As... THEN, be sure to change the extension from .html to .eld
Errata Sheet
If you find other errors, please forward them to me so I can place them here.
page 3 Joe Krutsinger no longer has the 800 number. His direct number is 913-334-2202. See page 711 for correct information.
page 217 Under Example, about half way down the page: “Assigns to Value1 the number -1” should read “Assigns to Value1 the number 1”
page 226 last paragraph: “…shown in Figures 10.11 and 10.12” should read “…shown in Figures 10.12 and 10.13.”
page 273 the code for the Key Reversal Down is correct, but the Plot1 statement should be changed to read "KeyRevDn" instead of "Brk Out High"
page 280 ADx should read ADX
Appendix Reserved Words
Category
- Future
- Future Option
- Stock
- Stock Option
- Index
- Currency Option
- Mutual Fund
- Money Market Fund
- Index Option
- Cash
- Bond
- Spread
- Forex
- CPC Symbol
- Composite
page 479 MaxConsecLosers and MaxConsecWinners should read:
MaxConsecLosers
Returns the largest number of consecutive closed losing trades.
EXAMPLES
MaxConsecLosers returns 5 if the largest number of consecutive closed losing trades is 5.
MaxConsecLosers returns 2 if the largest number of consecutive closed losing trades is 2.
MaxConsecWinners
Returns the largest number of consecutive closed winning trades.
EXAMPLES
MaxConsecWinners returns 5 if the largest number of consecutive closed winning trades is 5.
MaxConsecWinners returns 2 if the largest number of consecutive closed winning trades is 2.
(This error was caught by Ken McCoy. Thanks.)
